Wireless Monitoring and Telemetry Platform
Ultra-low Temperature Freezer (ULT) and LN2 tank Monitoring and Alerting, HACCP data logging, Smart Water meters with leakage detection, BMS and smart building control
About Seraphin IoT
Collect, browse, analyse and react to telemetry event data

IoT Wireless Monitoring and Telemetry platform
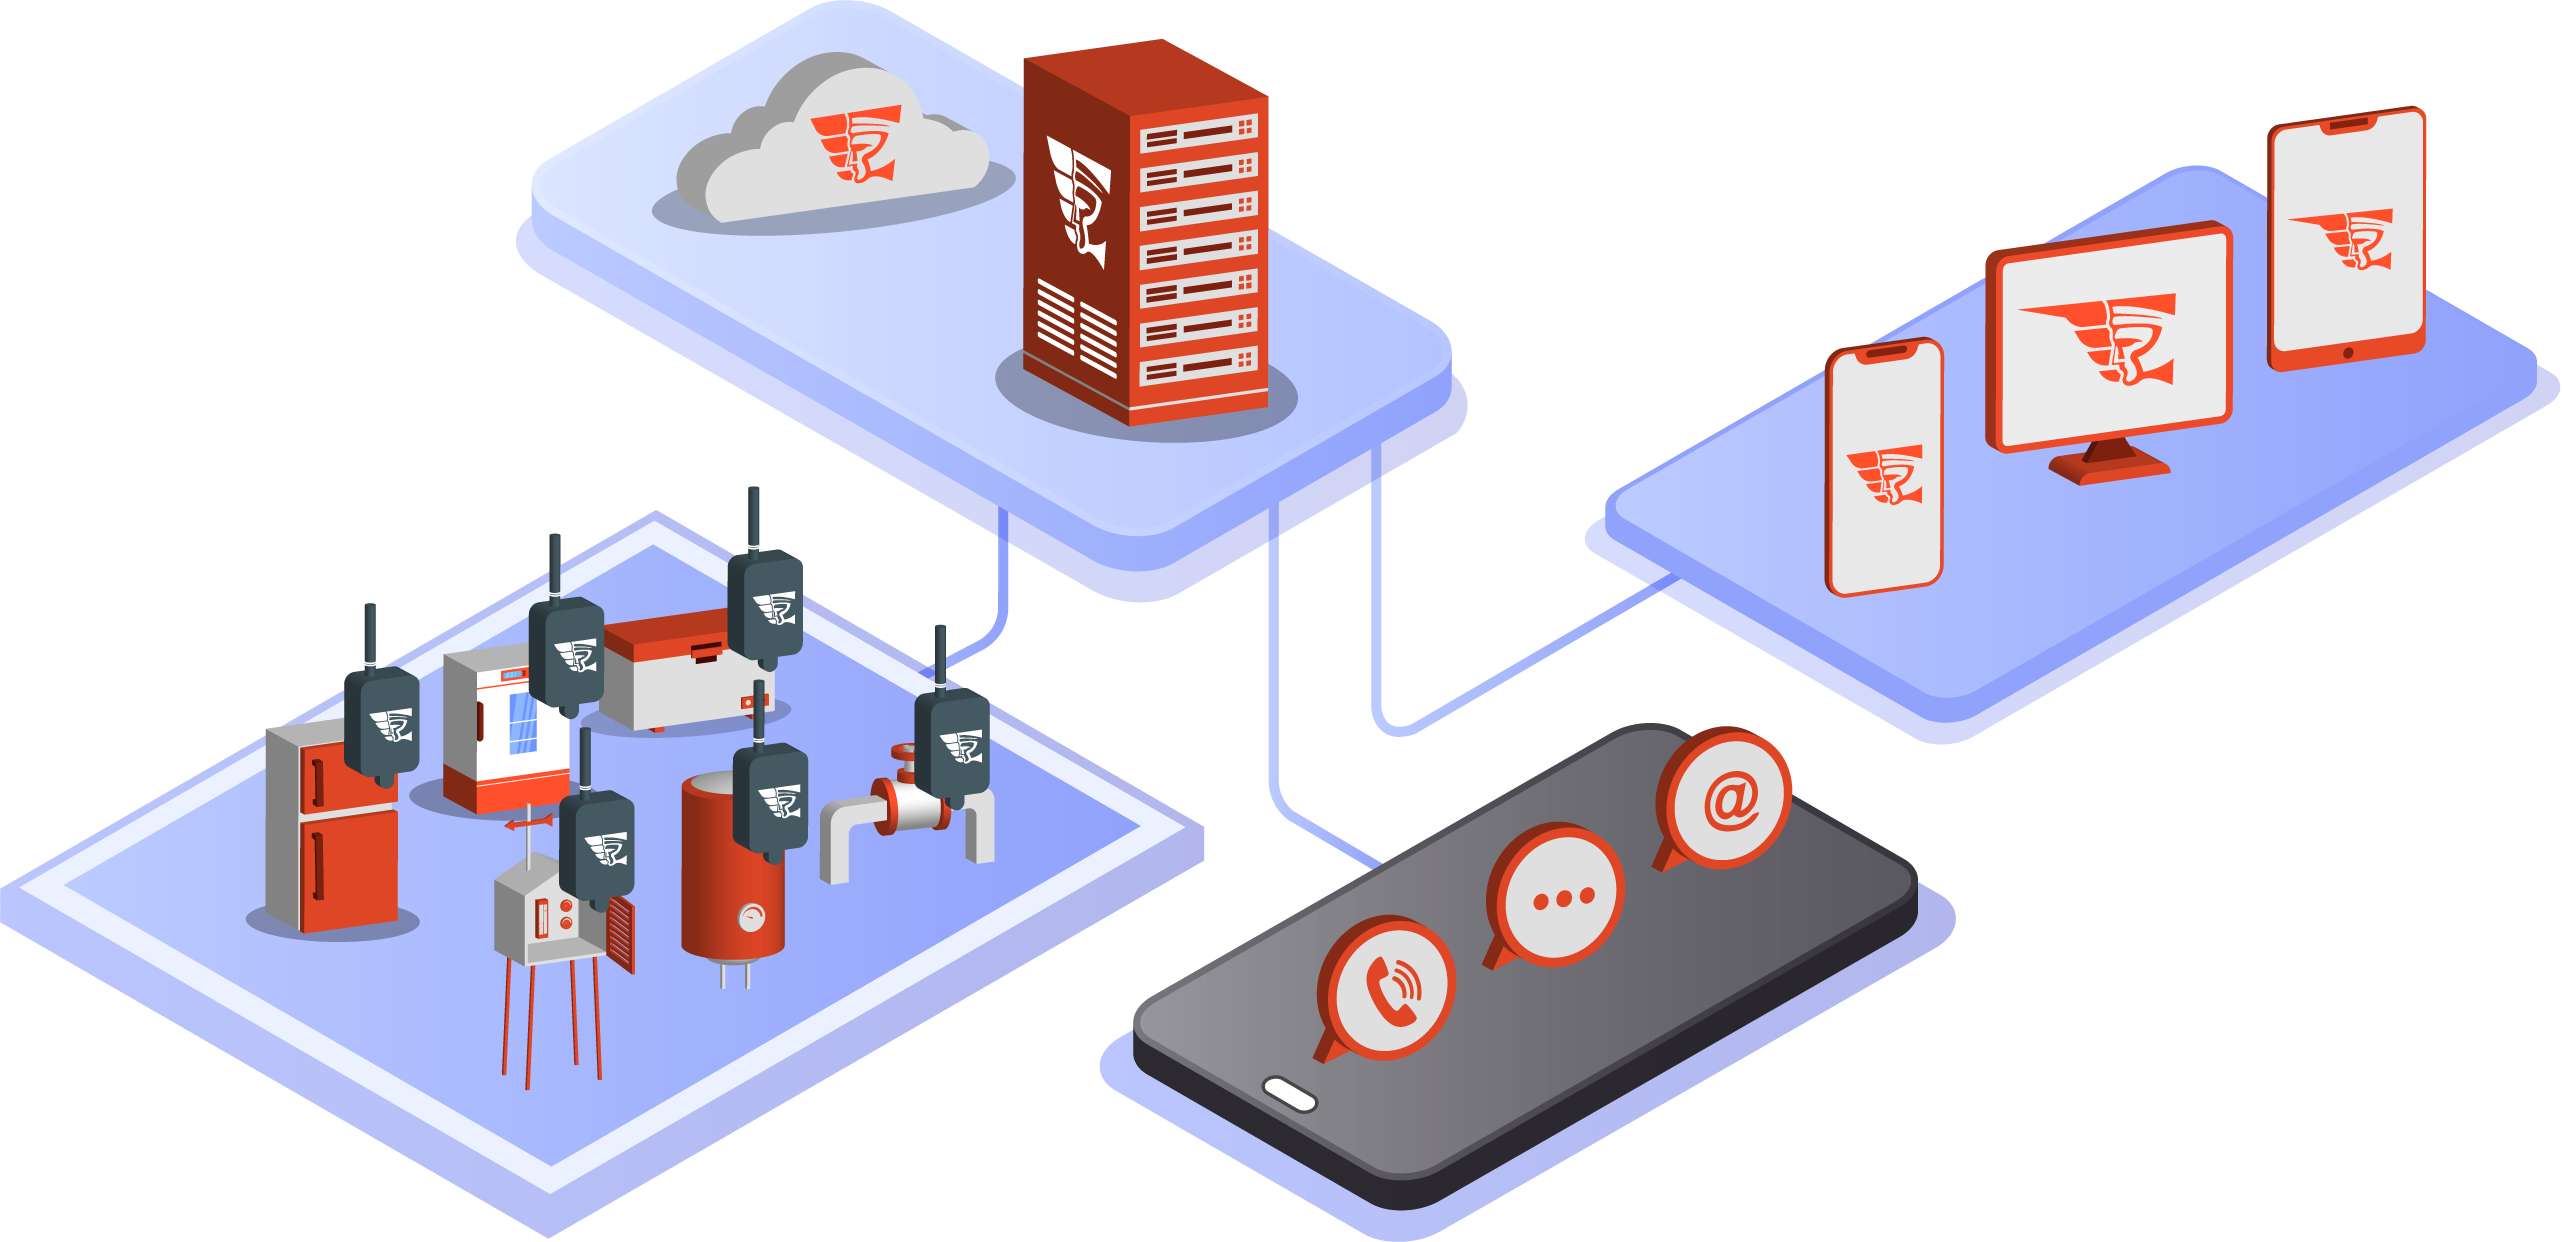
Seraphin Monitoring Platform is a comprehensive IoT software platform developed to provide real-time monitoring and rapid alert capability.
The system is designed to gather, evaluate and present telemetry data. Incoming data is evaluated against user defined rules. If rule conditions are met, the notification in the form of email, text message or a phone call is triggered to inform the user about alarm condition.
All sensor-sent telemetry data is stored in the cloud and available for live and retrospective view via a mobile friendly and secure web portal.
Use Cases across various industries

Scientific - Ultra Low Temperature (ULT) Freezers and LN2 tanks
See details
Facilities management - Water usage, occupancy, CO2, temperature
See details
Platform characteristics
Seraphin IoT is a cutting-edge, production-grade solution fully addressing the requirements of a modern and reliable software system.
AWS Cloud-native application
The platform is hosted within the AWS cloud, powered by the same infrastructure as Netflix and government websites.
The cloud-nativity of a software solution has tremendous impact on the design and quality of the overall solution. Cloud native application codebase ages much slower than the codebase of a regular application taken into the cloud.

End to end encryption
In LoRaWAN deployments data packets between sensors and gateways are encrypted using AES cipher. The gateway communicates with LoRaWAN Network Server over TLS. All LoRaWAN device deployments adopt the security practises descibed in LoRaWAN ™ SECURITY: A White Paper Prepared for the LoRa Alliance™ by Gemalto, Actility, and Semtech
Data segregation
The platform is designed to segregate data associated within a single organisation into its own space - completely separated from other organisations. This ensures greater security of data reducing likelihood of data loss in the event of infrastructure or user error.
Role based access control
Seraphin IoT is designed to support 4 access roles - User, Client, Partner and Root. While the latter enjoys full access to system across the entire cloud, Users are allowed a restricted view and read-only access to data specific to organisation they belong to.
99.9% Uptime commitment
Seraphin IoT data ingestion endpoints are highly available services guaranteeing 99.9% uptime commitment which is specifically mentioned in the underlying AWS SLA document.
No single point of failure
Seraphin IoT data ingestion endpoints, as well as the database the solution uses to store all event data, have been architected to work as a distributed system in a fault-tolerant manner.
Vertical and horizontal scaling
Reliability and performance are inherent in the product, ensuring you can expect the platform to scale with predictable performance whether you gather data from a handful or thousands of IoT devices.
This makes Seraphin IoT platform the ideal solution for startups, large corporations as well as re-sellers thanks to the platforms support for multi-tenancy.
Event-based data feeds
Seraphin IoT can forward all sensor-received data in an event-push manner to external integration endpoints.
Text and binary data formats
The platform can be configured to work with any data format - text or binary, structured or unstructed irrespective of whether the data is ingested or emitted to external systems.

Supported protocols
Seraphin IoT Telemetry Platform can work with a variety of devices supporting different IoT connectivity standards

Sensor management
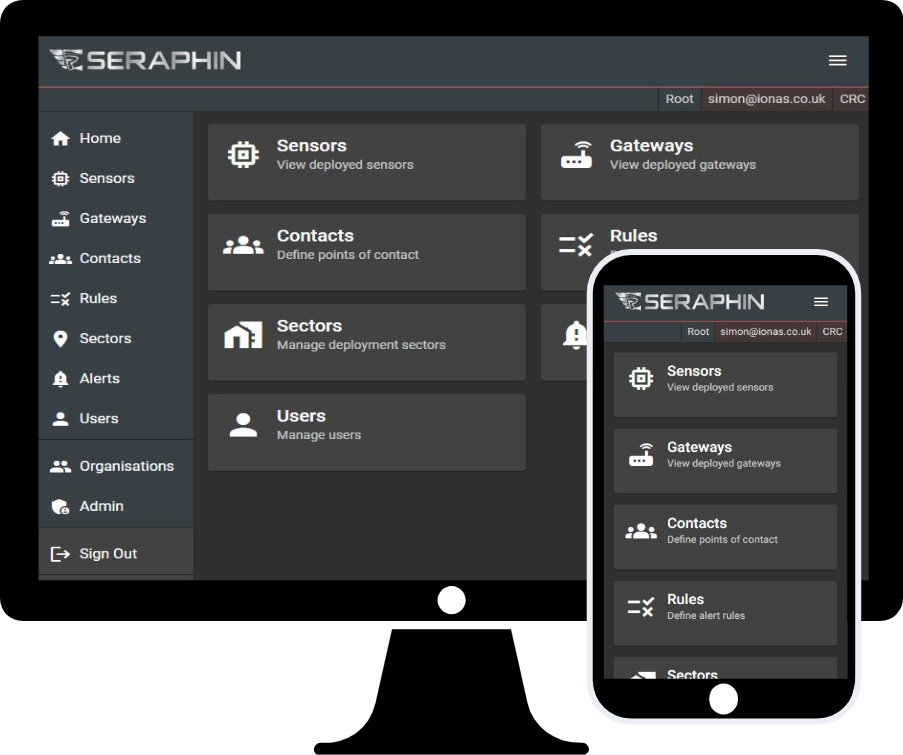
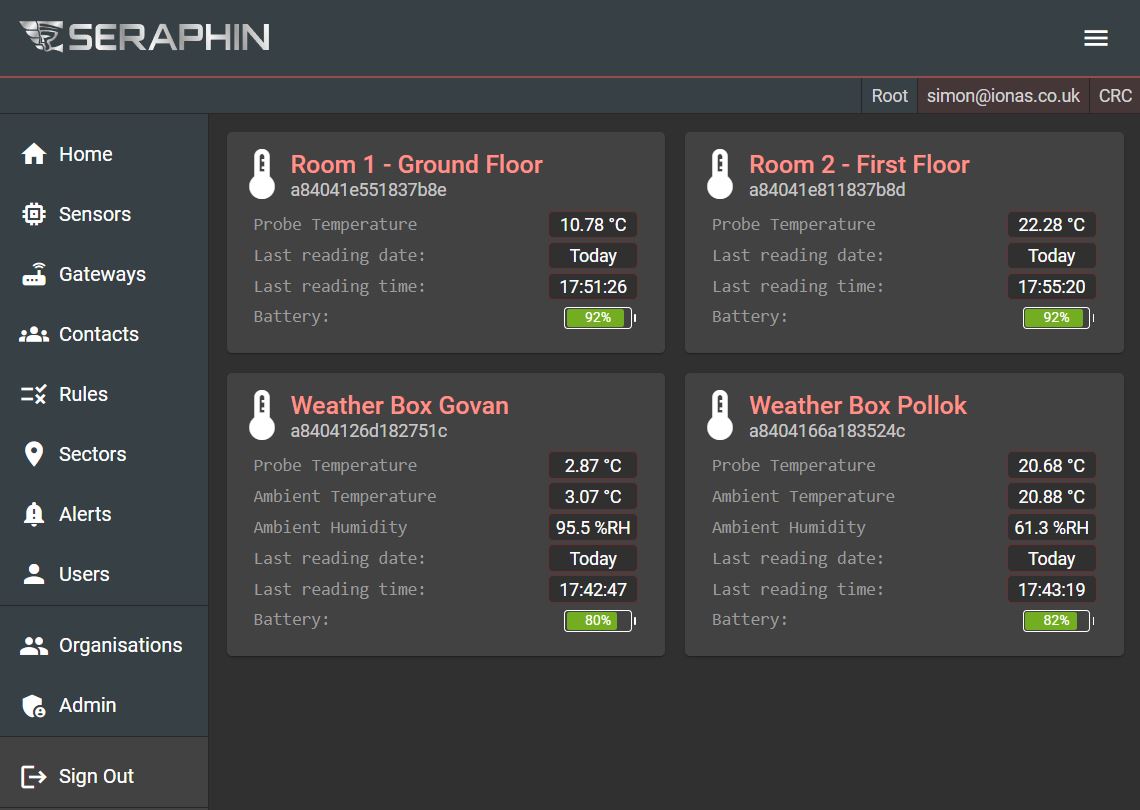
Browse through your sensors and access the collected data through the portal. It’s a convenient way to remotely monitor your assets whether you manage only a handful or hundreds of them.
The portal gives you the ability to organise your sensors into meaningful categories. You may want to group them according to their physical location, type, or purpose. It is easy to move sensors between these groups customising the views according to personal preferences.
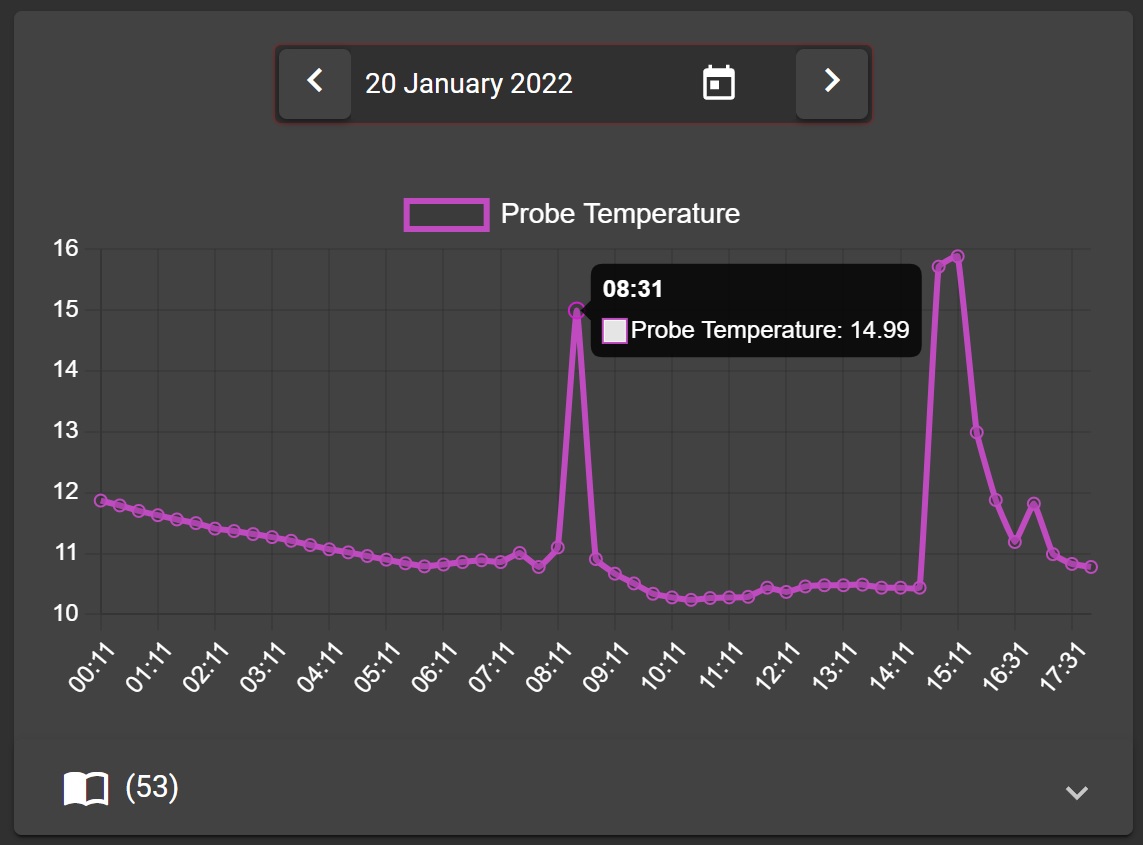
Zooming in on a specific sensor uncovers the latest data gathered throughout the day. The data is plotted on a line chart for easy insight and clear presentation. In addition, all historical data is at your fingertips, available for browsing as an easy to view and pageable table.
Event rule evaluation
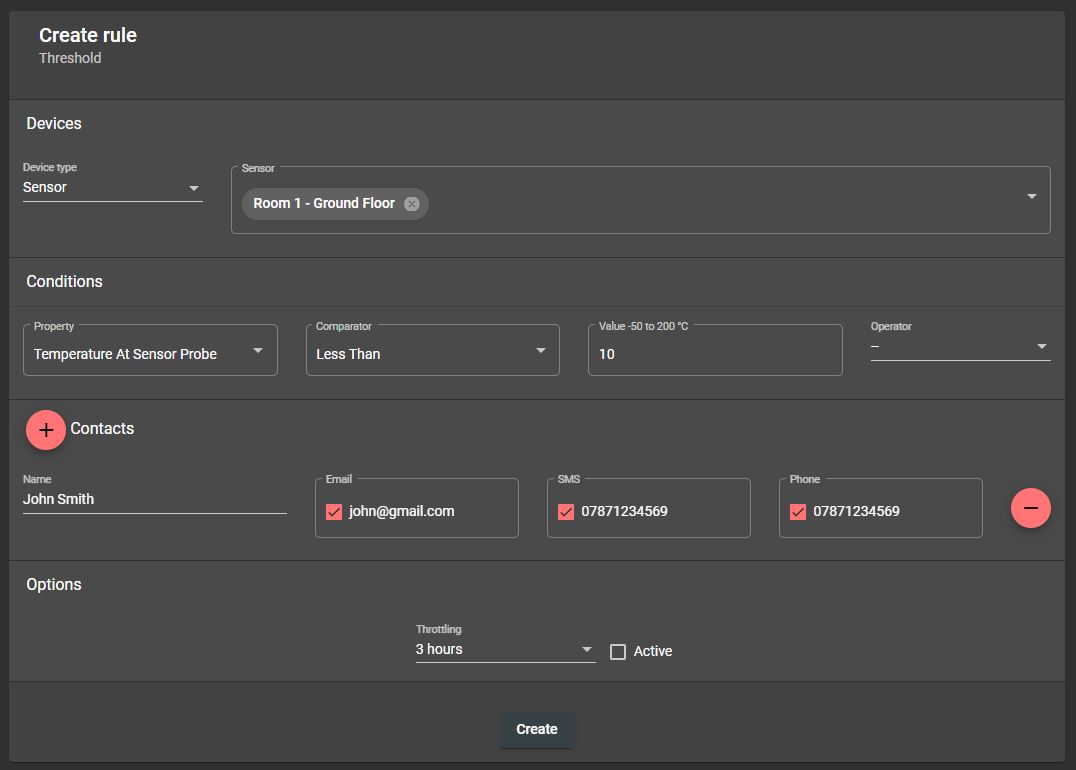
Rules are at the core of the platform. Every incoming telemetry event that the platform receives is checked against them, and result determines whether an alert should be triggered. You can create any number and tailor them to the different telemetry data your sensors can send.
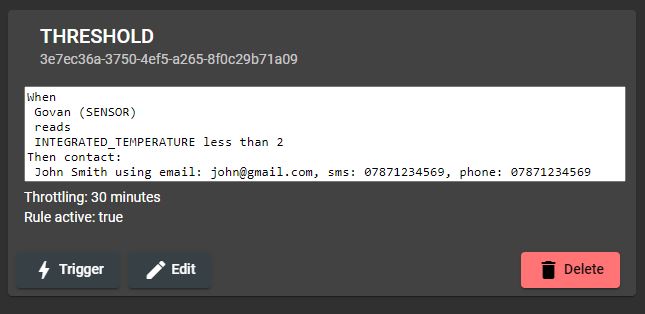
A typical rule definition follows an industry recognised pattern of ‘For…, When…, Then’. For example: for a particular sensor measuring temperature, when the reading drops below a specified value, then contact people on the list. This easily understood rule pattern can be readily transformed to an extremely performant condition evaluation routine that is guaranteed to carry minimal footprint for the computing resources required to execute the rule.
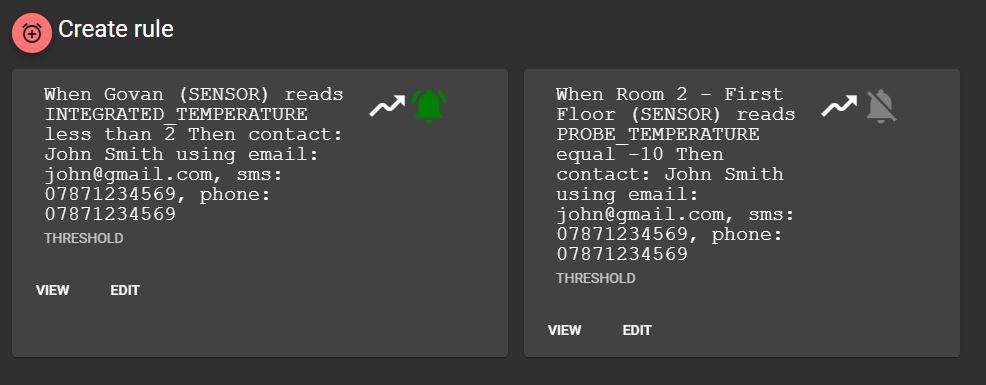
Performance is important because The Seraphin IoT Monitoring and Telemetry Platform places no restrictions on the number of rules you define. Some of the rules you create will require immediate activation, some will be used only for testing and may or may not be eventually enabled in your production environment. The online portal makes it easy to browse through all rules you have defined, test each one in isolation and finally stage for production deployment or keep them in testing.
As an owner of an organisation onboarded onto the Seraphin Monitoring Platform you have the ability to grant multiple users admin access to your organisation. This will give them the ability to look at your data and view alert triggering rules you defined.
Alert management
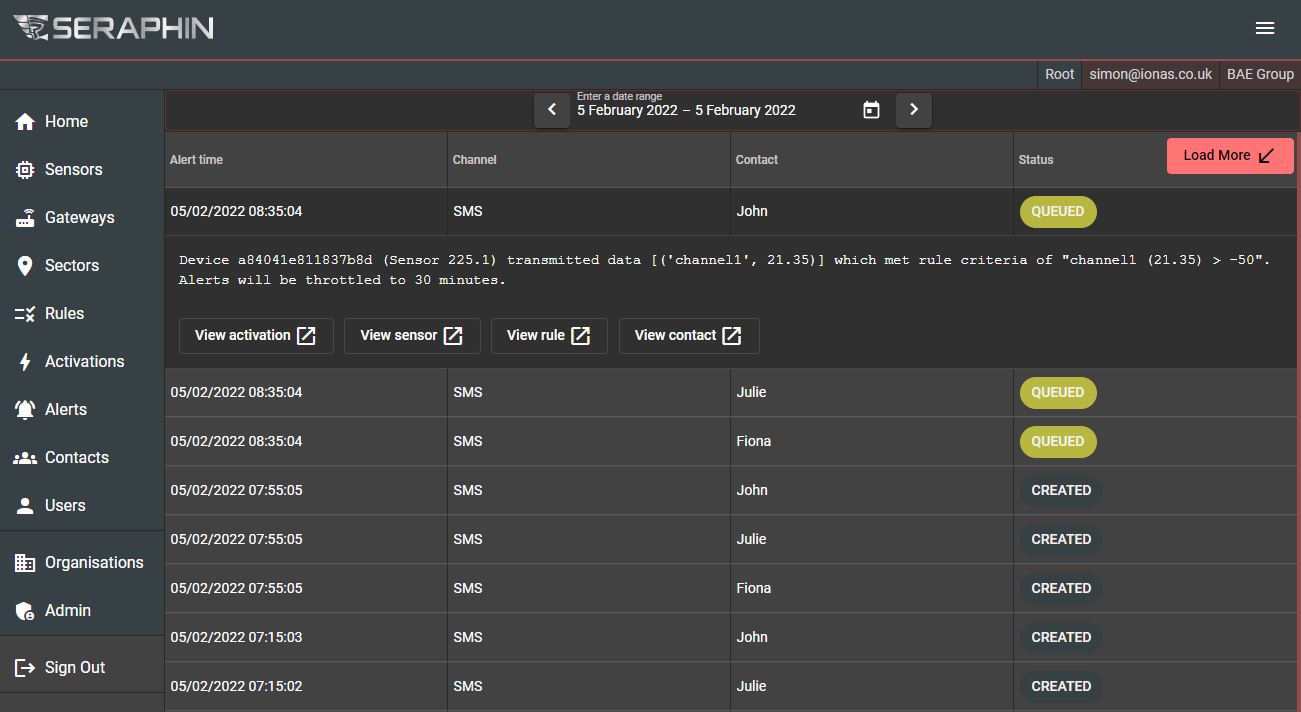
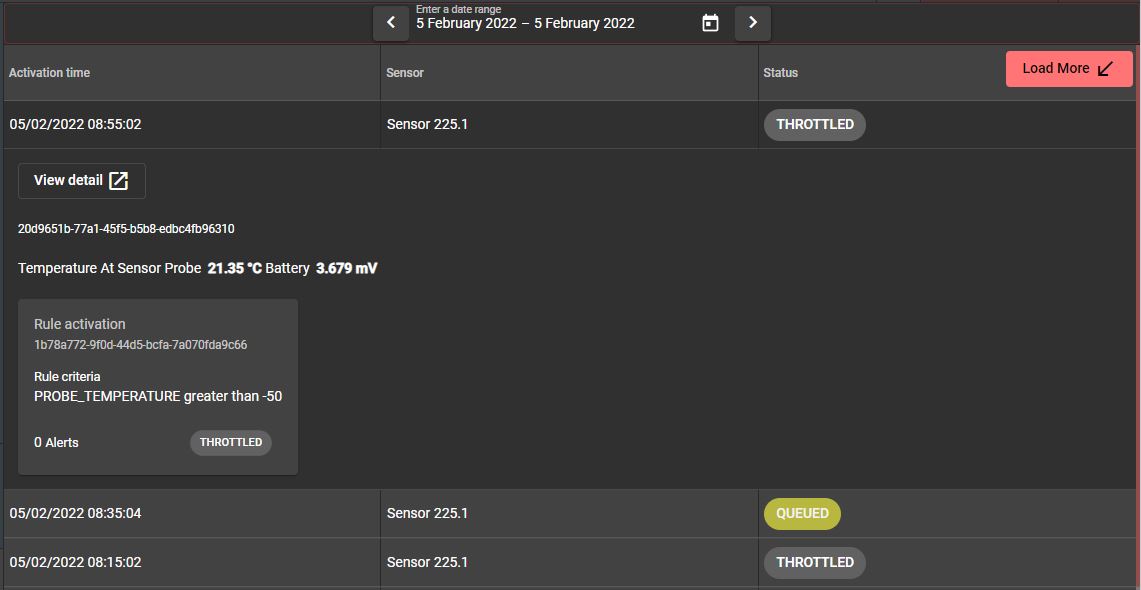
The portal makes it easy to get an overview of all alerts that the system has initiated. You can easily access all information related to the context in which the alert was trigerred. This includes view into the telemetry event that coused the alert to fire, rule criteria that the telemetry event has met, and all people in your organisation that have been selected as a point of contact.
Only rules that meet the criteria you define can trigger notification alerts. Use the portal to inspect rules that resulted in notification attempts. A complete log of all activated rules for every telemetry event that your sensors transit is always available for total transparency.


